In this blog post we deal with tightness tests with gaseous medium on underground pipelines. Here we focus on the influence of ambient air temperature on the temperature at different soil depths and the influence of temperature change on the tightness test.
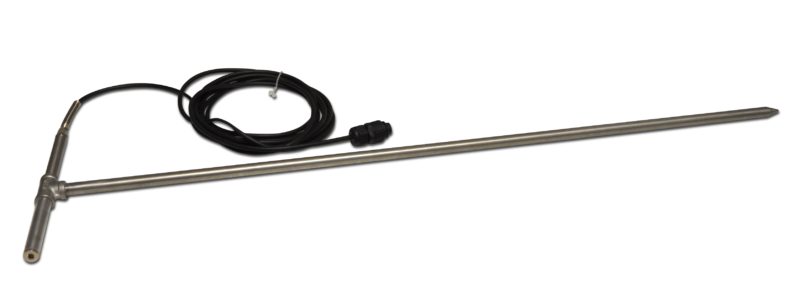
Temperature sensor
The temperature curves were determined with earth spikes at different soil depths and in air close to the ground. The absolute accuracy of the sensors is 0.1 °C, measured value resolution 0.01 K (Kelvin). We observe the air temperature over six days and the ground temperature at different depths.
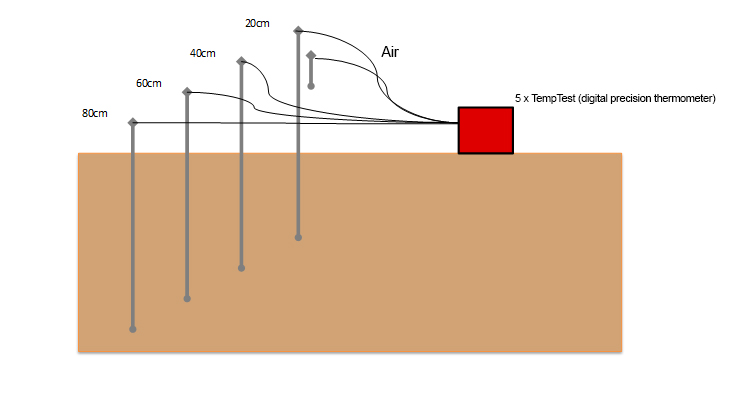
In order to measure the temperatures at different depths, one spike was rammed into the ground 20, 40, 60 and 80 cm deep. To document the air temperature, a sensor was attached to an earth spike at knee height, hanging freely in the air. The measured values were stored with 5 TempTest devices every 15 minutes.
Experimental set-up for temperature measurement
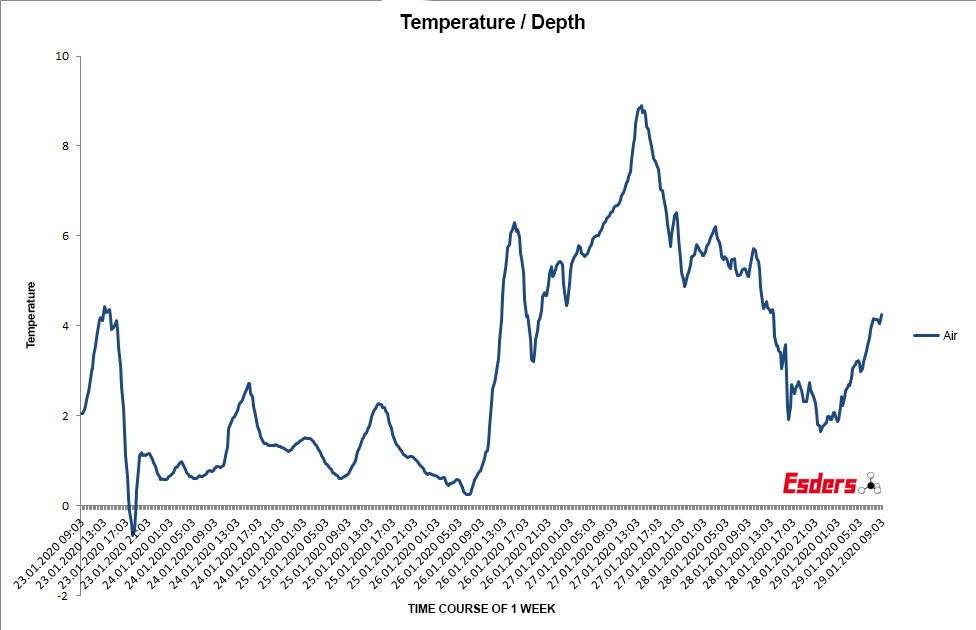
The course of the air temperature over six days, the maximum difference is about 10 °C (lowest / highest value).
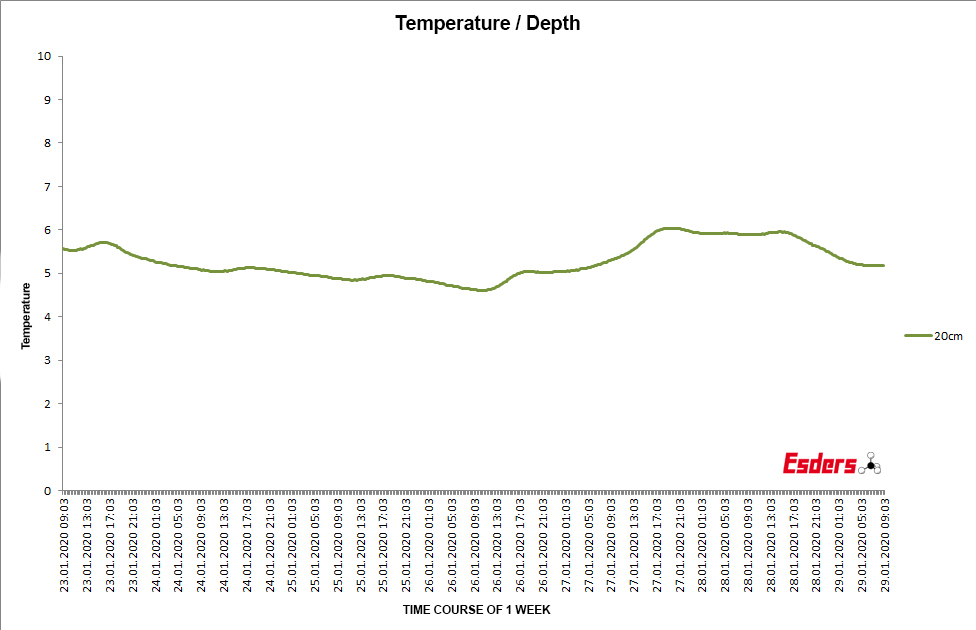
The graph shows the course of the soil temperature at 20 cm depth. Here a damping of the peaks is clearly visible. The difference is 1.44 °C from the lowest to the highest value.
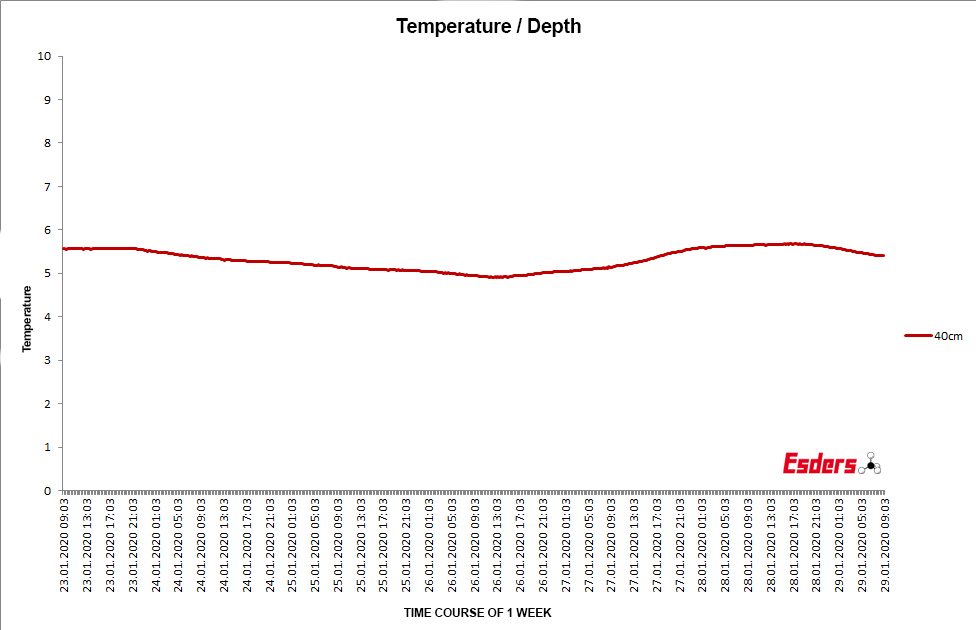
This is to be followed by the course of the soil temperature at a depth of 40 cm. A further attenuation of the peaks is clearly visible.
The difference is still 0.78 °C from the lowest to the highest value.
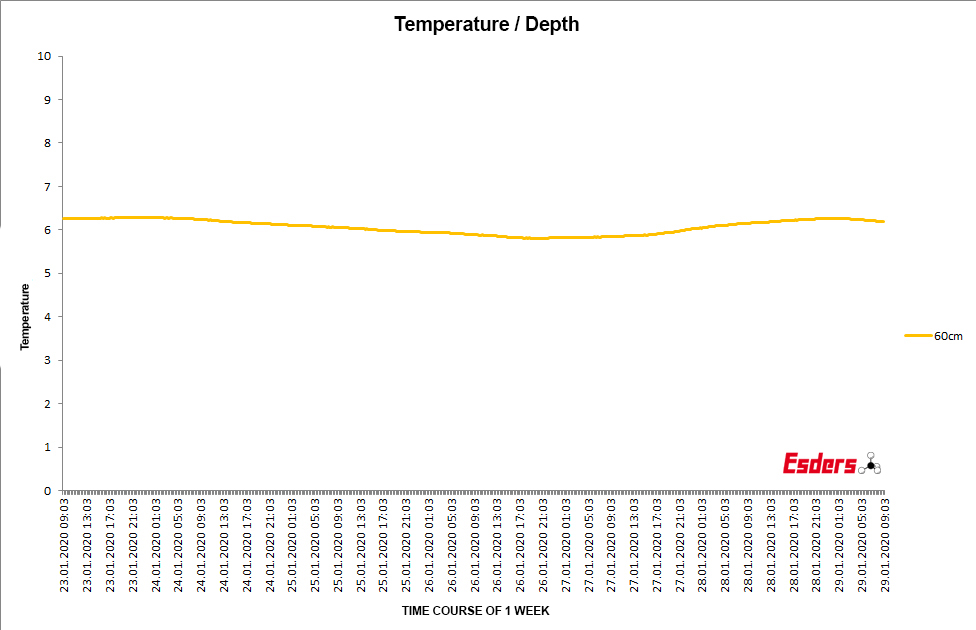
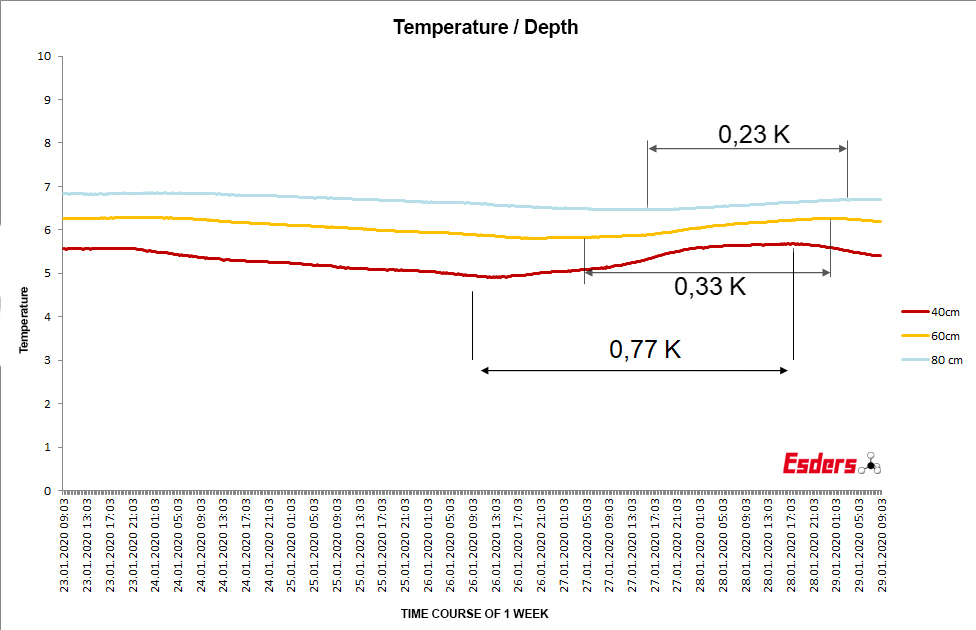
In the following diagram the course of the soil temperature has been measured at a depth of 60 cm.
The difference here is only 0.48 °C between the lowest and the highest value.
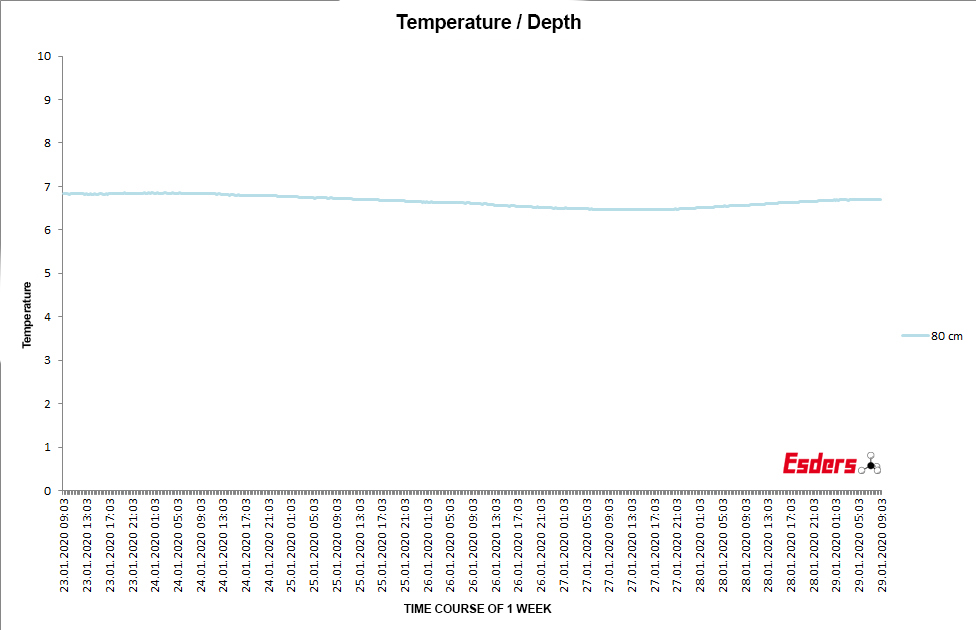
The graph below shows the course of the soil temperature at a depth of 80 cm. The difference between the lowest and the highest value is much smaller here, at 0.39 °C.
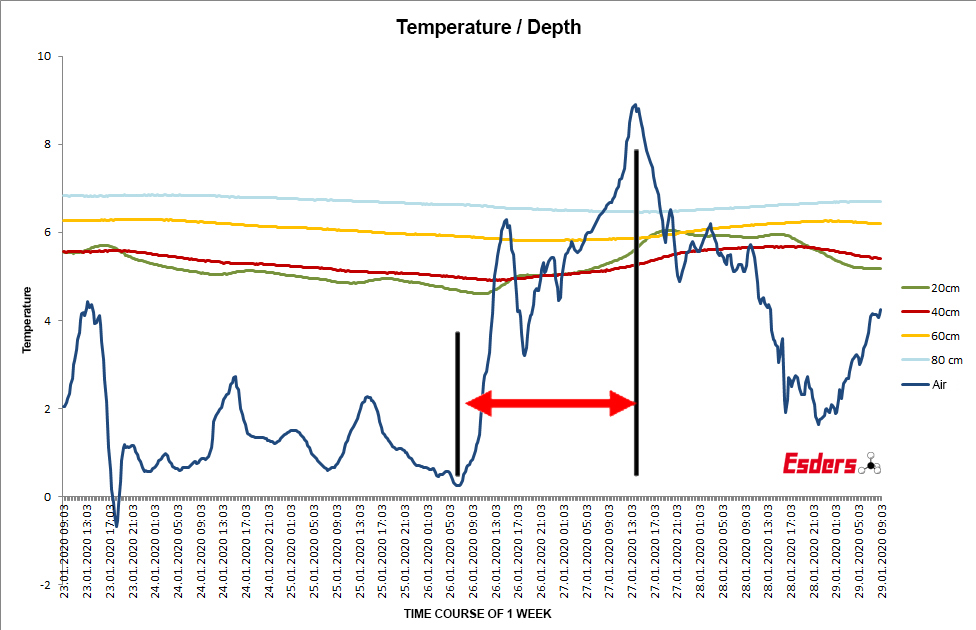
Overview of all temperature curves
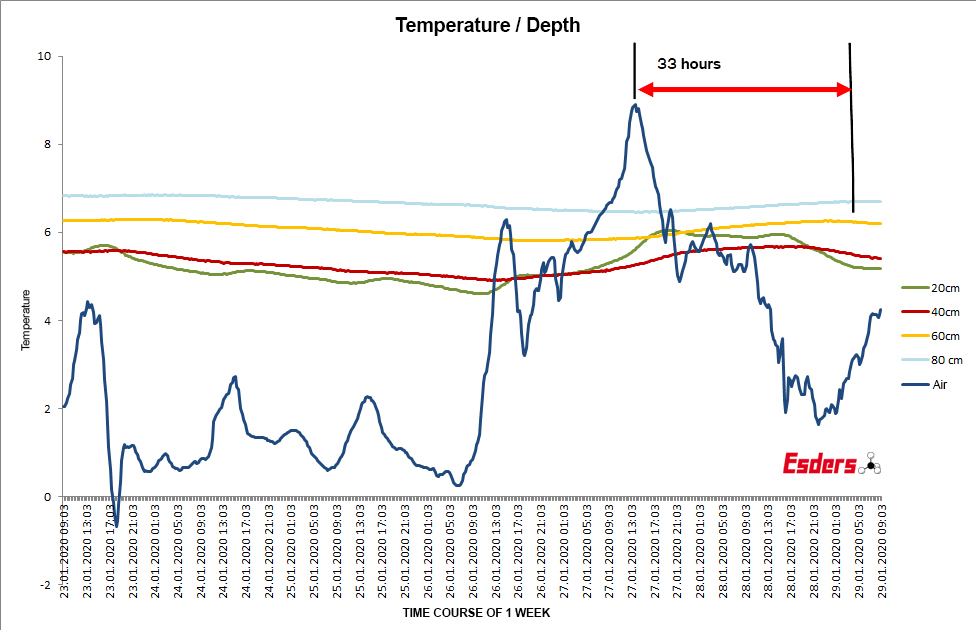
The air temperature changes significantly in the course of a day and until the following noon. The selected observation period: 26.1. from 06:48 hrs until 27.1. at 13:48 hrs. As expected the temperature changes of the air have less and less effect with increasing depth. The temperature curve is smoothed.
Overview of six days and temperature rise in one section
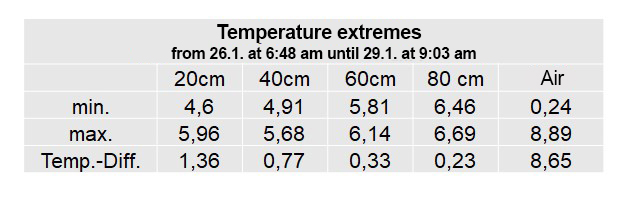
How does the change of ambient air temperature in the marked area (06:48-13:48) affect the ground temperature? Since we know that the ground is time-delayed for showing the temperature, the extreme values are shown in the table until January 29 at 09:03. While the temperature change in the air was 8.65 °C, for example, 1.36 °C could still be measured in 20 cm depth and only 0.23 °C in 80 cm depth.
Time delay between air and ground temperature
How long is the time delay approximately?
In addition to smoothing the temperature curve, the soil also has a time-delaying effect. Between the maximum daily temperature (air) and the sensor at a depth of 60 cm, the time delay is 33 h.
What does this mean for the pressure test?
Not only coming temperature fluctuations, which perhaps the weather forecast tells us well in advance, are important. If strong temperature changes in the air have occurred in the last 24 or 48 hours, they can have an effect later in an ongoing pressure test, even afterwards.
K=Kelvin (international basic unit for temperature and temperature differences)
What role does the temperature change in the soil play that is transferred to the medium in the pipe (air)?
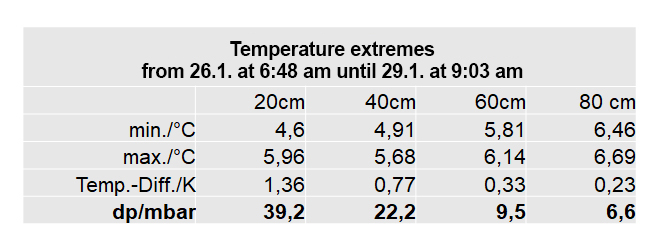
The formula for the isochoric change of state of ideal gases (law of Amontons) is used. It states that temperature and pressure are proportional to each other (p1/p2 = T1/T2), if the volume does not change. At an absolute test pressure of 8 bar (7 bar test pressure), one obtains the pressure differences (dp) from the above table.
In the example 20 cm soil depth:
The temperature of the air in the pipe increases by 1.36 °C, resulting in a pressure increase of 39.2 mbar.
It is also very obvious that with increasing depth each additional cm of coverage becomes “less important”. The relationship is not linear, but exponential. This has the following effect, for example: Between 20 cm and 40 cm depth there is a difference of 17 mbar, between 60 and 80 cm depth there is only a difference of 2.9 mbar!
A thought play at the end: How do you actually assess the case when the earth spike does not reach all the way down to the pipe (pipe apex), e.g. when the temperature is measured 40 cm above the pipe? Is this a benefit for the on-site inspector or not?
Answer: Probably not, because the basic principle is that temperature fluctuations should be avoided. This is proven by measuring the soil temperature at a suitable location, i.e. near the pipeline or by measuring at points of the pipe particularly exposed to the temperature influence, namely the exposed ends of the pipe with a contact sensor. The example calculations have shown why we should avoid or at least minimize temperature fluctuations in the pipe. If, however, the maximum pressure drop is slightly exceeded during a pressure test, correct temperature measurement can help to assess the situation. The better the measurement can reflect the change in the pipeline, i.e. it is measured close to the pipeline, the easier it is to assess whether the changes in temperature can be the cause of a pressure drop or pressure increase.
With a calculation of the effect of the measured temperature changes on the pressure, it is clear whether I can put a pipeline into operation or the test has to be repeated.
Our recommendation: Due to the complexity of the interrelationships, an evaluation of the temperature influence should only be carried out by specially trained and experienced personnel.